
Staying ahead in the Bitcoin scaling race means knowing how to monitor and analyze Bitcoin rollup performance metrics in real time. With the rise of zero-knowledge (ZK) rollups and a growing suite of L2 and L3 solutions, developers, traders, and investors need actionable insights into how these protocols actually perform under stress. Let’s break down the practical steps and tools you need to track rollup analytics on Bitcoin, so you can spot bottlenecks, benchmark throughput, and make informed decisions faster than the next node operator.
Why Monitoring Bitcoin Rollup Performance Matters
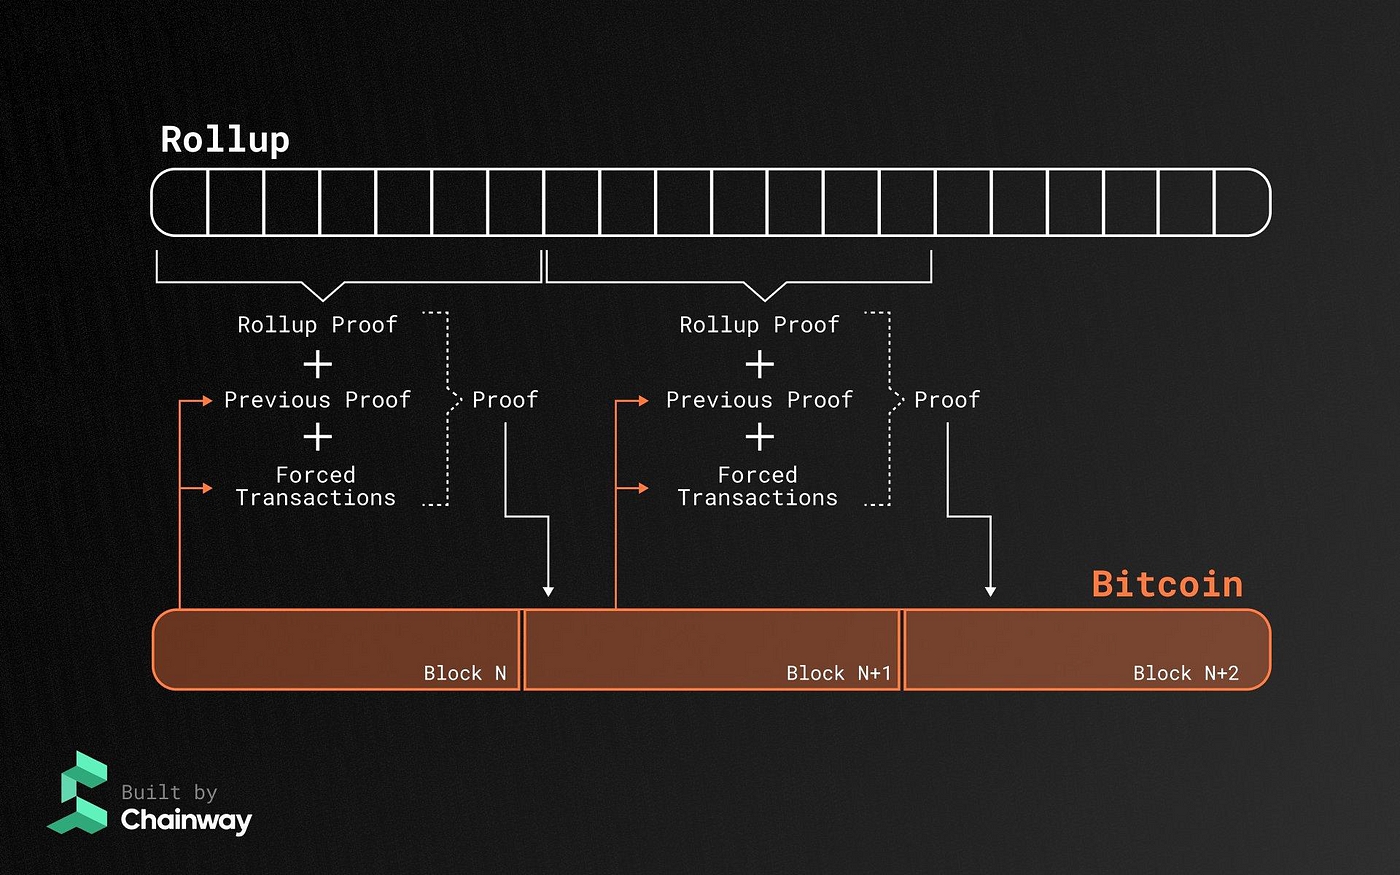
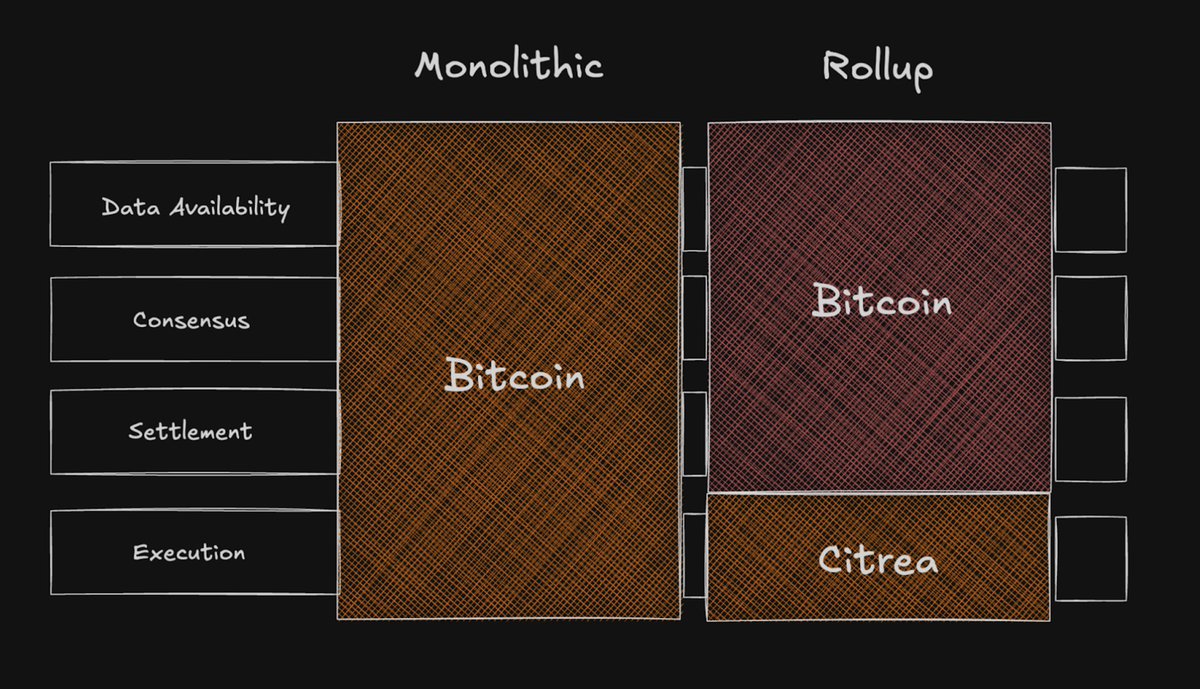
Rollups aggregate transactions off-chain, compressing data before submitting succinct proofs back to Bitcoin’s base layer. This design promises massive scalability boosts, but only if the performance holds up under real-world pressure. Monitoring key metrics like transactions per second (TPS), proof generation time, and resource usage is crucial for:
- Developers: Optimize code paths and infrastructure.
- Traders: Anticipate congestion or delays that can impact trade execution.
- Investors: Benchmark projects for long-term viability in a competitive landscape.
The difference between a smooth batch settlement at scale versus a bottlenecked rollup can mean millions in transaction fees or lost arbitrage opportunities.
The Essential Metrics: What to Track
Essential Metrics for Monitoring Bitcoin Rollups
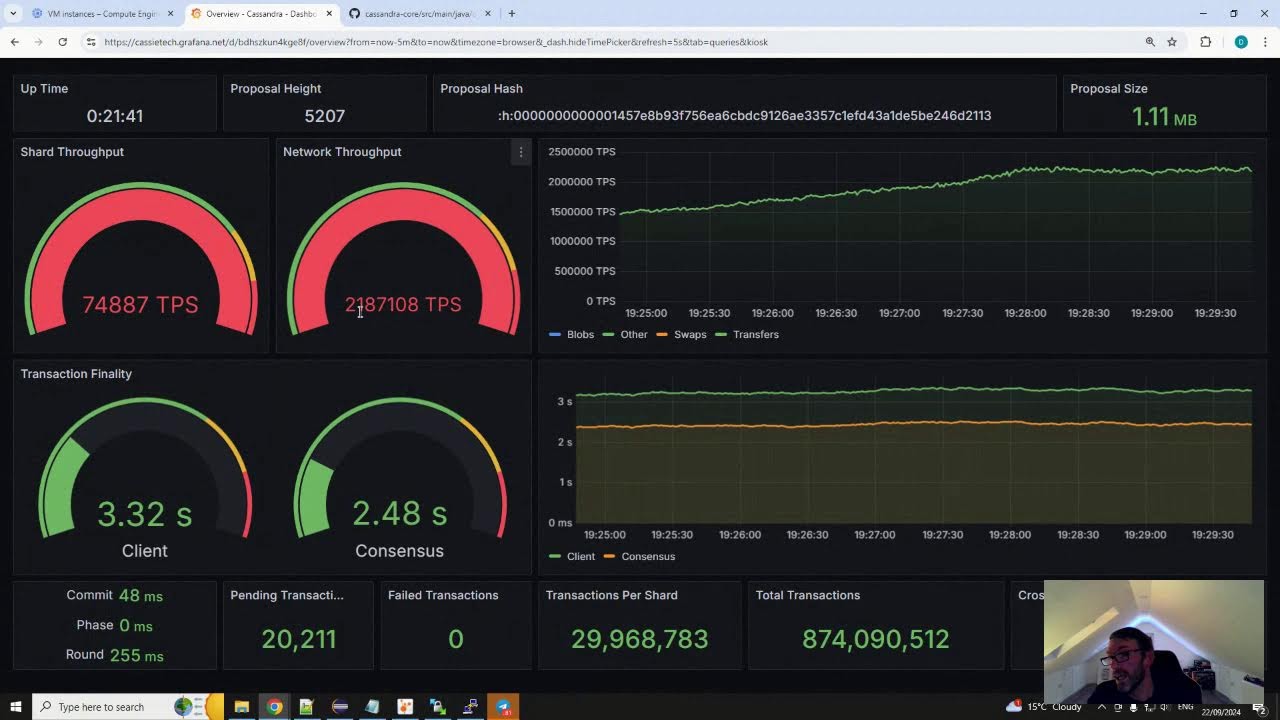
- Transactions Per Second (TPS): This core metric measures how many transactions a rollup processes each second, directly reflecting scalability and throughput. Higher TPS indicates greater transaction capacity for the Bitcoin network.
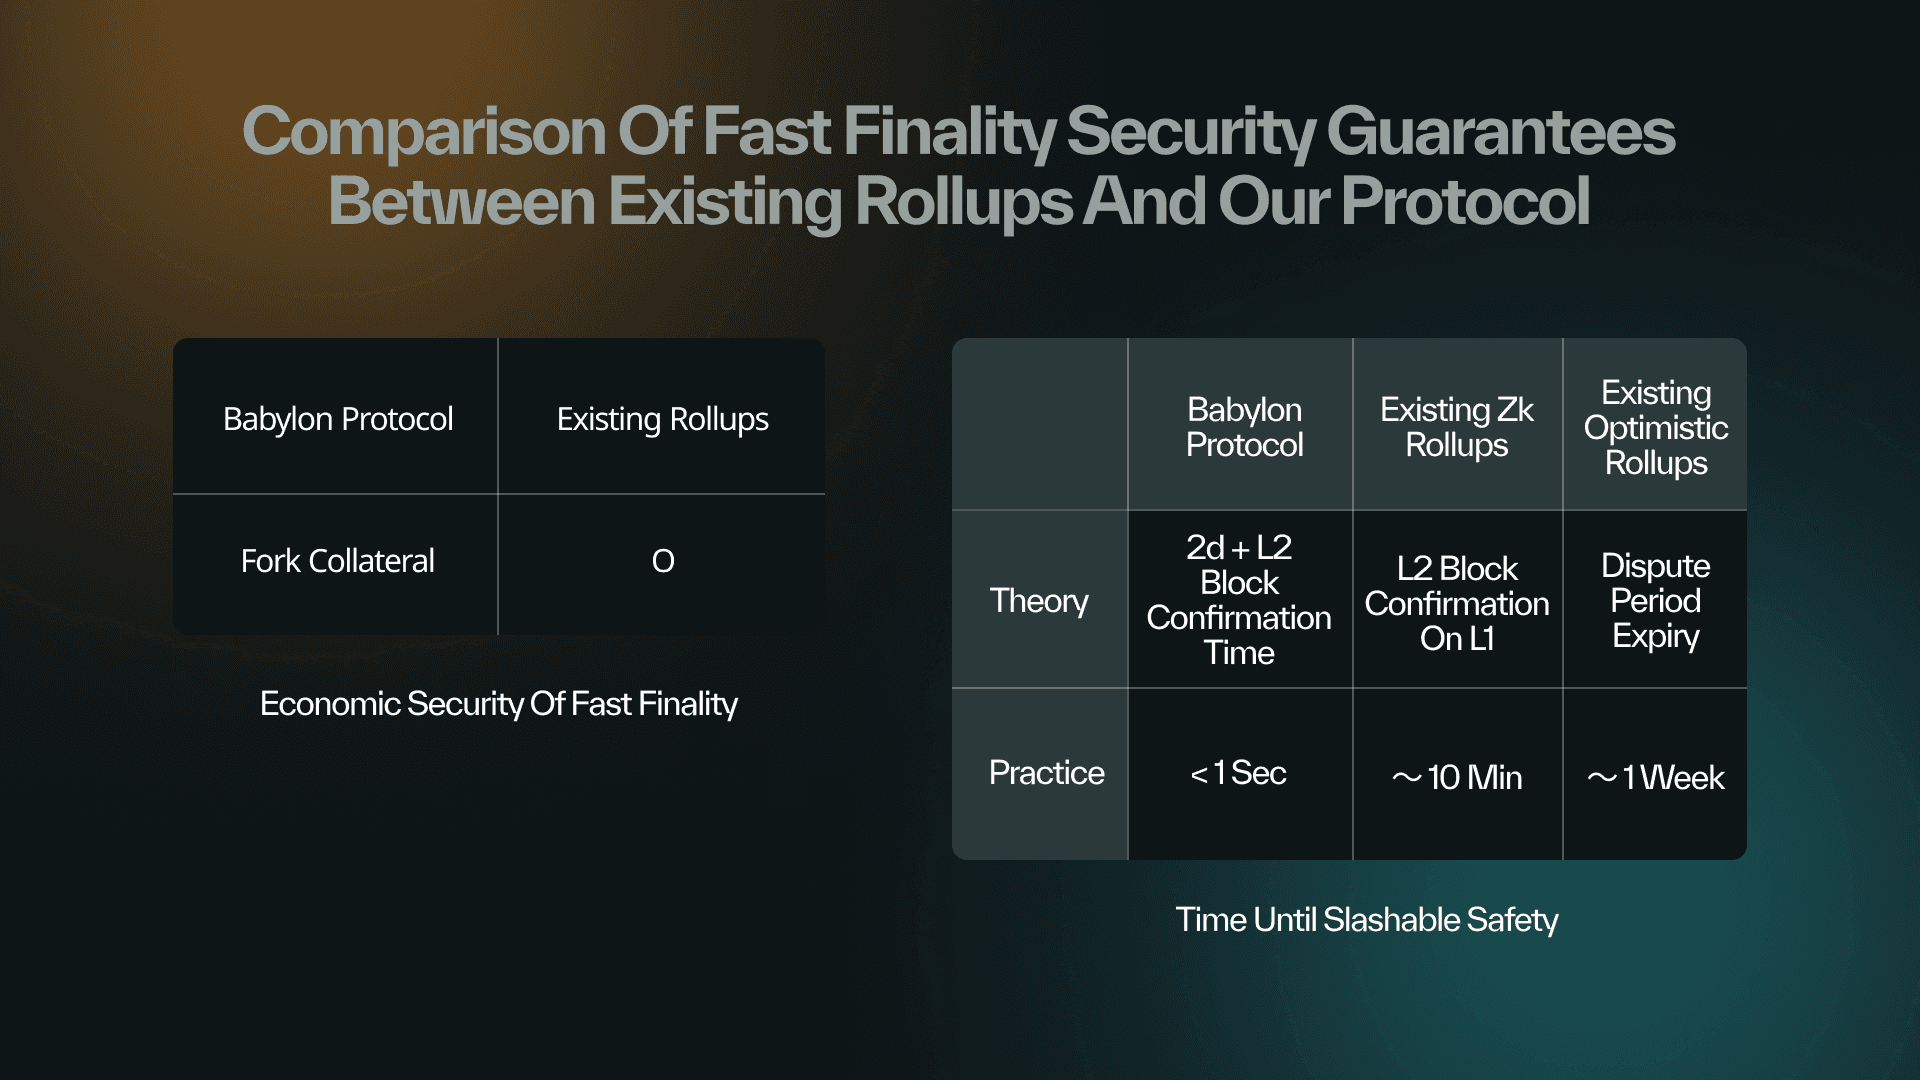
- Proof Generation Time: Tracks the time required to generate cryptographic proofs (such as zero-knowledge proofs) for each transaction batch. Shorter proof times mean faster settlement and improved user experience.

- Time to Finality: Measures the duration from transaction submission to when it becomes irreversible on the Bitcoin blockchain. Lower time to finality enhances user confidence and network usability.
- Resource Utilization: Monitors CPU, memory, and network bandwidth consumed by rollup nodes. Efficient resource use ensures cost-effective scaling and reliable operations.
- On-chain Data Cost: Assesses the cost of posting rollup data to the Bitcoin mainnet. Lower on-chain data costs improve the economic efficiency of rollup solutions.
- Batch Size: Indicates the number of transactions aggregated in a single rollup batch. Larger batch sizes can enhance efficiency but may impact proof generation time and finality.
- Security Metrics (Fraud/Validity Proofs): Evaluates the frequency and effectiveness of fraud or validity proofs, which are critical for maintaining the integrity of rollup transactions.
The most important Bitcoin rollup performance metrics include:
- Transactions Per Second (TPS): The core throughput measurement, how many transactions are processed every second by the rollup.
- Proof Generation Time: How long it takes to generate cryptographic proofs for each batch, a critical factor for finality speed.
- Time to Finality: The end-to-end duration from transaction submission to irreversible confirmation on Bitcoin’s base layer.
- Resource Utilization: CPU, memory, and bandwidth consumed by nodes running the rollup protocol, vital for understanding operational costs.
If you’re benchmarking multiple projects or running your own node, these KPIs are your dashboard dials. For a deeper dive into cost structures per transaction within ZK-rollups, check out this technical analysis from Cryptology ePrint Archive (source provided above).
The New Wave: Real-Time Rollup Analytics Platforms
No more flying blind! The latest wave of analytics platforms is making it easier than ever to monitor Bitcoin rollups as they operate. One standout is Bitcoin Heartbeat by BVM, which offers transparent dashboards tracking L2 and L3 project activity in real time. This platform arms users with verifiable data on throughput, latency spikes, and ecosystem health, crucial for traders watching market cycles or devs troubleshooting deployments.
This level of transparency is game-changing. Instead of waiting for post-mortem reports after congestion events or outages, you get a live feed of what’s happening across major rollups built on top of Bitcoin right now.
Tactical Tools: From Prometheus to Custom Load Testing Frameworks
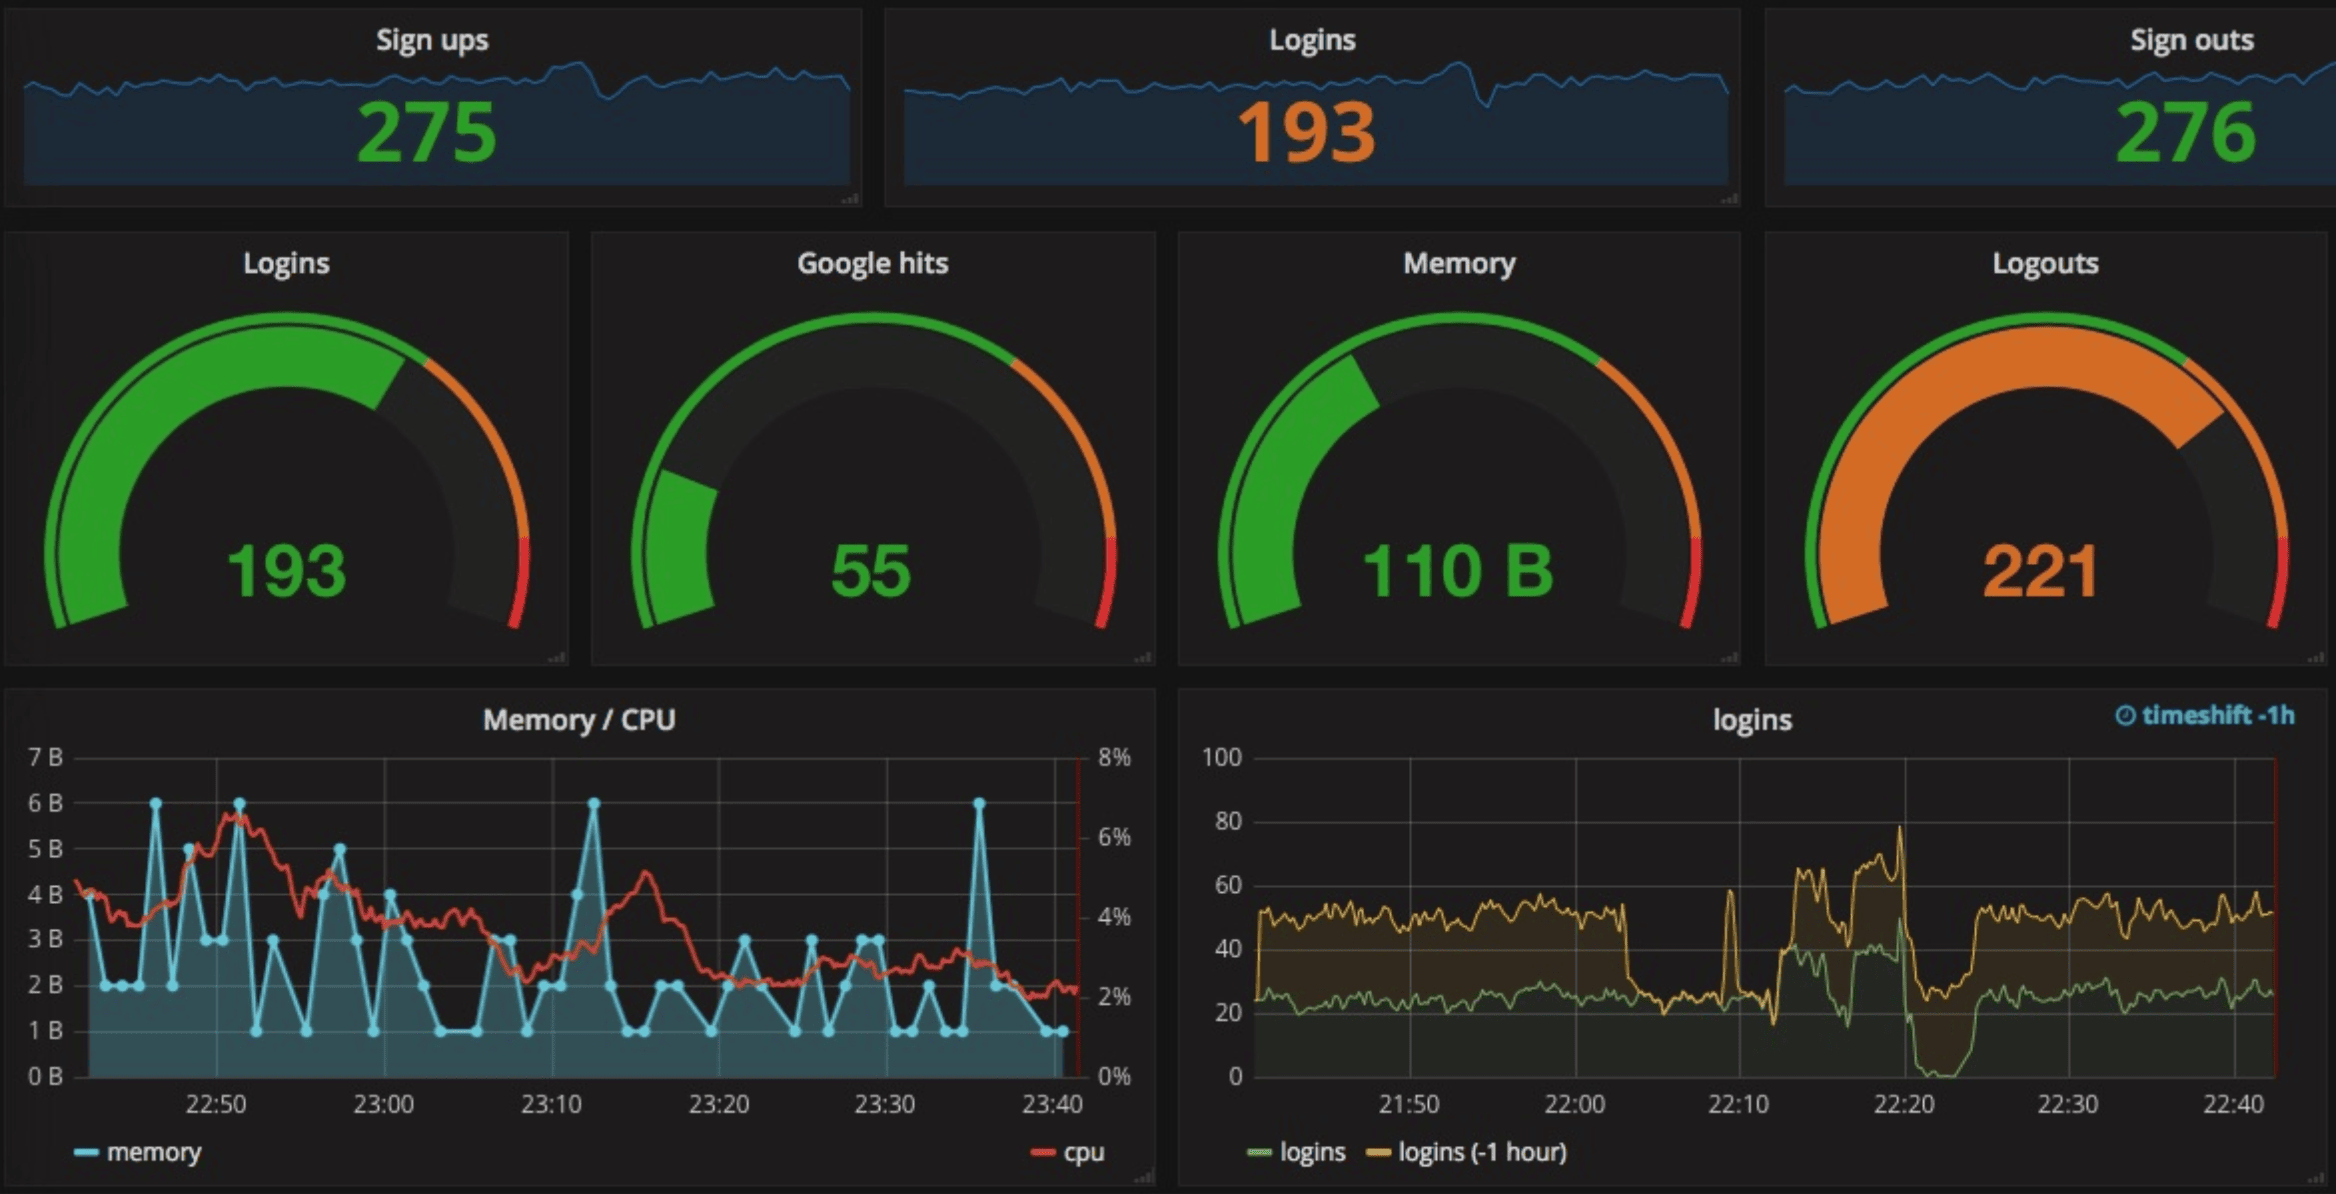
If you’re operating your own infrastructure or building new scaling solutions, integrating robust monitoring tools is non-negotiable. While bespoke options tailored specifically for Bitcoin are emerging fast, many teams adapt proven frameworks from Ethereum’s ecosystem, think Prometheus paired with Grafana dashboards, to track everything from TPS swings to memory leaks in off-chain components (see Optimism's tooling guide here). Load testing frameworks like those described by Markaicode are also invaluable: simulate realistic transaction patterns, incrementally ramp up load until failure points emerge, then fine-tune accordingly.
Best Practices for Monitoring Bitcoin Rollups
- Leverage Real-Time Analytics Platforms like Bitcoin Heartbeat: Platforms such as Bitcoin Heartbeat by BVM provide transparent, real-time dashboards for tracking Bitcoin L2 and L3 rollup activity, enabling instant visibility into throughput and network health.
- Integrate Proven Monitoring Tools (Prometheus & Grafana): Adapt established monitoring stacks like Prometheus and Grafana—widely used in Ethereum rollup ecosystems—to capture metrics such as transaction throughput, latency, and resource utilization on your Bitcoin rollup infrastructure.
- Conduct Structured Load Testing with Open-Source Frameworks: Use open-source load testing tools (e.g., Locust, JMeter) to simulate transaction spikes and identify bottlenecks. Monitor KPIs like TPS, proof generation time, and system resource usage to optimize performance under stress.
- Continuously Track Key Performance Metrics: Regularly monitor Transactions Per Second (TPS), proof generation time, time to finality, and resource consumption. Use historical data to benchmark improvements and spot anomalies early.
- Stay Updated on Emerging Rollup Solutions: Follow reputable sources like Cointelegraph, BeInCrypto, and technical archives (e.g., Cryptology ePrint Archive) to keep abreast of new Bitcoin rollup projects and monitoring innovations, especially in the rapidly evolving ZK-rollup space.

The bottom line? Whether you’re benchmarking established ZK-rollups or experimenting with bleeding-edge protocols leveraging zero-knowledge proofs for compression tricks (as covered here), real-time performance data is your edge in this rapidly evolving arena. In the next section we’ll dive deeper into interpreting these metrics, and how they translate into actionable strategies for developers and traders alike.
Interpreting the Data: From Metrics to Actionable Insights
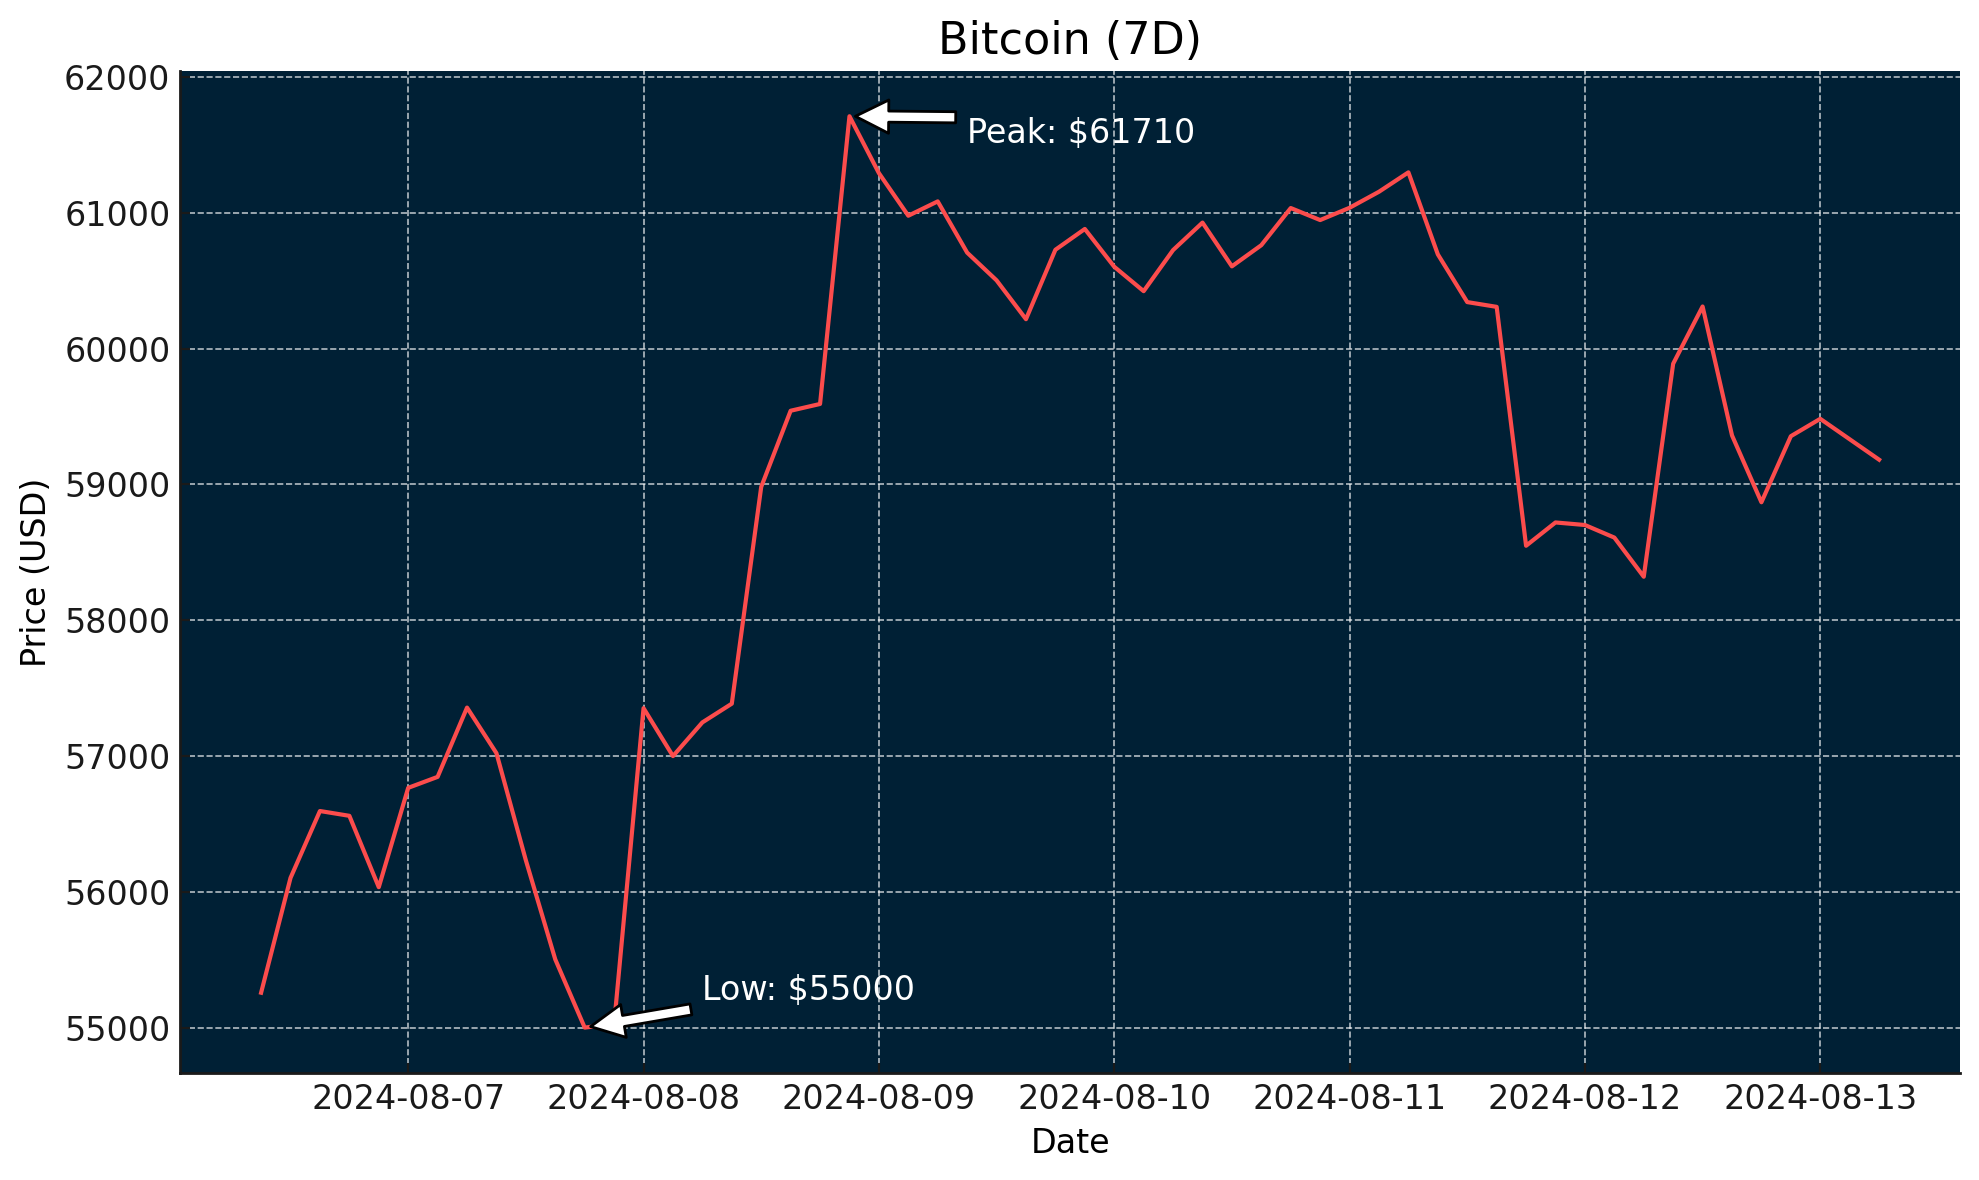
Collecting rollup analytics is just the first step. The real value comes from interpreting these metrics in context and using them to inform your next move. For example, a sudden spike in proof generation time might signal a bottleneck in cryptographic computation, prompting devs to optimize circuit design or allocate more resources. Meanwhile, traders can use latency and TPS data to anticipate periods of congestion, crucial for timing entries and exits during volatile swings.
Resource utilization metrics offer another layer of insight. If a rollup’s CPU or memory usage consistently trends upwards under moderate loads, it could be a red flag for future scalability, or an opportunity for early optimization before it impacts users. For node operators and protocol builders, monitoring these patterns helps prevent outages and keeps the network humming even as transaction volumes surge.
Benchmarking and Comparing: How to Evaluate Competing Rollups
The Bitcoin scaling landscape is fiercely competitive. To separate signal from noise, it’s essential to benchmark multiple projects side-by-side using consistent criteria. Compare TPS under similar load conditions, measure proof generation times across different ZK implementations, and track resource efficiency over sustained test periods.
Key Criteria for Benchmarking Bitcoin Rollup Performance
- Transactions Per Second (TPS): The number of transactions a rollup processes per second is a core metric for assessing scalability and efficiency.
- Proof Generation Time: Measure how long it takes to generate cryptographic proofs for each batch of transactions—crucial for understanding latency and user experience.

- Time to Finality: Track the duration from transaction submission to final, irreversible settlement on the Bitcoin blockchain.
- Resource Utilization: Analyze CPU, memory, and network bandwidth usage during rollup operations to gauge infrastructure efficiency.
- On-Chain Data Costs: Evaluate the fees and costs associated with posting rollup data to the Bitcoin blockchain, impacting overall transaction economics.

- Security and Verifiability: Assess the transparency and auditability of rollup proofs and data, leveraging platforms like Bitcoin Heartbeat for real-time monitoring.
- Throughput Under Load: Use load testing frameworks to determine how rollups perform under stress and high transaction volumes.

- Upgrade and Compatibility Tracking: Monitor how rollups adapt to protocol upgrades and maintain compatibility with Bitcoin’s evolving network.
This approach not only highlights which solutions are truly scalable but also exposes trade-offs between speed, security, and decentralization. Remember that some rollups may prioritize ultra-fast settlement at the expense of decentralization or higher operational costs, knowing where each project stands empowers investors and builders alike.
Staying Ahead: Continuous Monitoring in a Dynamic Market
The pace of innovation in Bitcoin scaling means yesterday’s top performer can quickly be outpaced by new entrants leveraging breakthroughs in zero-knowledge proofs or data compression techniques (see latest research here). Continuous monitoring isn’t just about catching failures, it’s about spotting emerging leaders early and adapting your strategy as the landscape shifts.
Platforms like Bitcoin Heartbeat are already making this easier by aggregating L2/L3 analytics into accessible dashboards. But don’t stop there, combine these feeds with your own custom metrics or alerts tailored to your risk profile or application needs.
Final Thoughts: Your Edge in the Rollup Race
Mastering Bitcoin rollup performance metrics gives you an edge, whether you’re optimizing infrastructure, trading fast markets, or evaluating which project will lead the next wave of adoption. Stay curious, keep your dashboards live, and don’t be afraid to experiment with new tools as they hit the scene.
The future of Bitcoin scaling is being written right now by those who pay attention, and act on, the data flowing through these next-gen protocols.


No comments yet. Be the first to share your thoughts!